
PROFITHistorical snapshot

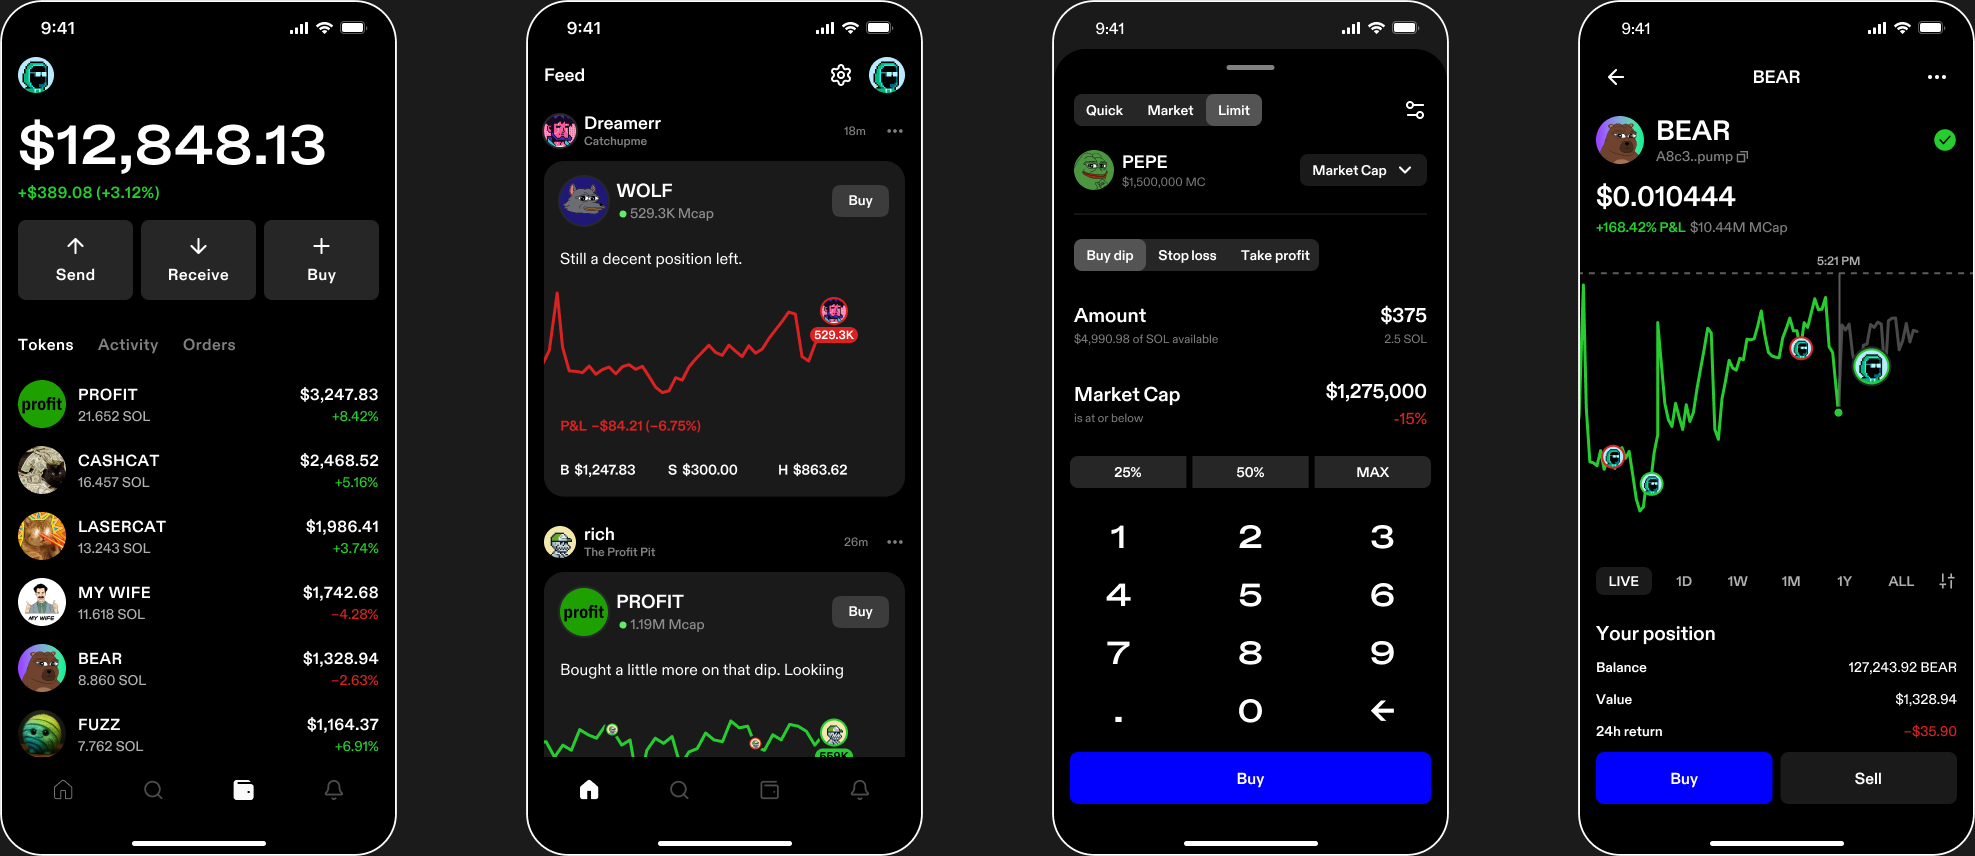
I designed a social feed for Vector, a crypto trading app. Readers could inspect a trader’s shared buys and sells, discuss the position, and trade in the same app.
When I joined Vector, it was a founder-built prototype and active trading had not begun. My first job was to make the mobile app more approachable for people who weren’t professional traders.
People already shared buys and sells in Discord and Telegram. Understanding a trade meant moving between the conversation, a chart, and a trading tool. A single post also left out the sequence: was this a first buy, a partial sale, or a return to an earlier position?
Traders could share a completed buy or sell with a comment. We called it a broadcast. The grouped card opened on the latest update; swiping back revealed the shared trades behind the position.
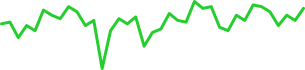
One trade made a useful post. Twenty updates from the same person could take over the feed. We grouped broadcasts by trader and coin, keeping each trade’s comment and associated P&L inside the card. Readers could start with the latest update and swipe back through the shared sequence. The tradeoff was a busier chart as updates accumulated.

Moving “Buy” to the coin screen would have given the broadcast more room and placed deeper information before execution. We kept “Buy” beside the coin name so readers could open Quick Buy and choose an amount without leaving the feed. The coin screen remained available for deeper information and the reader’s own position.

On mobile, each trade had room for a chart and comment. Early desktop work carried that treatment over, but feedback led us toward a denser table beside the chart. Traders could scan more activity and hover over a row for details. Phil Jacobson, Vector’s former VP of Operations, later estimated that roughly 5% of users generated 95% of trading volume. The desktop experience reached beta but never launched publicly. Read Jacobson’s account
I rebuilt this interaction in Conductor for the case study. The screenshot shows that recent reconstruction. Select an earlier trade to move the highlight and inspect its comment and position state. Trade values are illustrative.
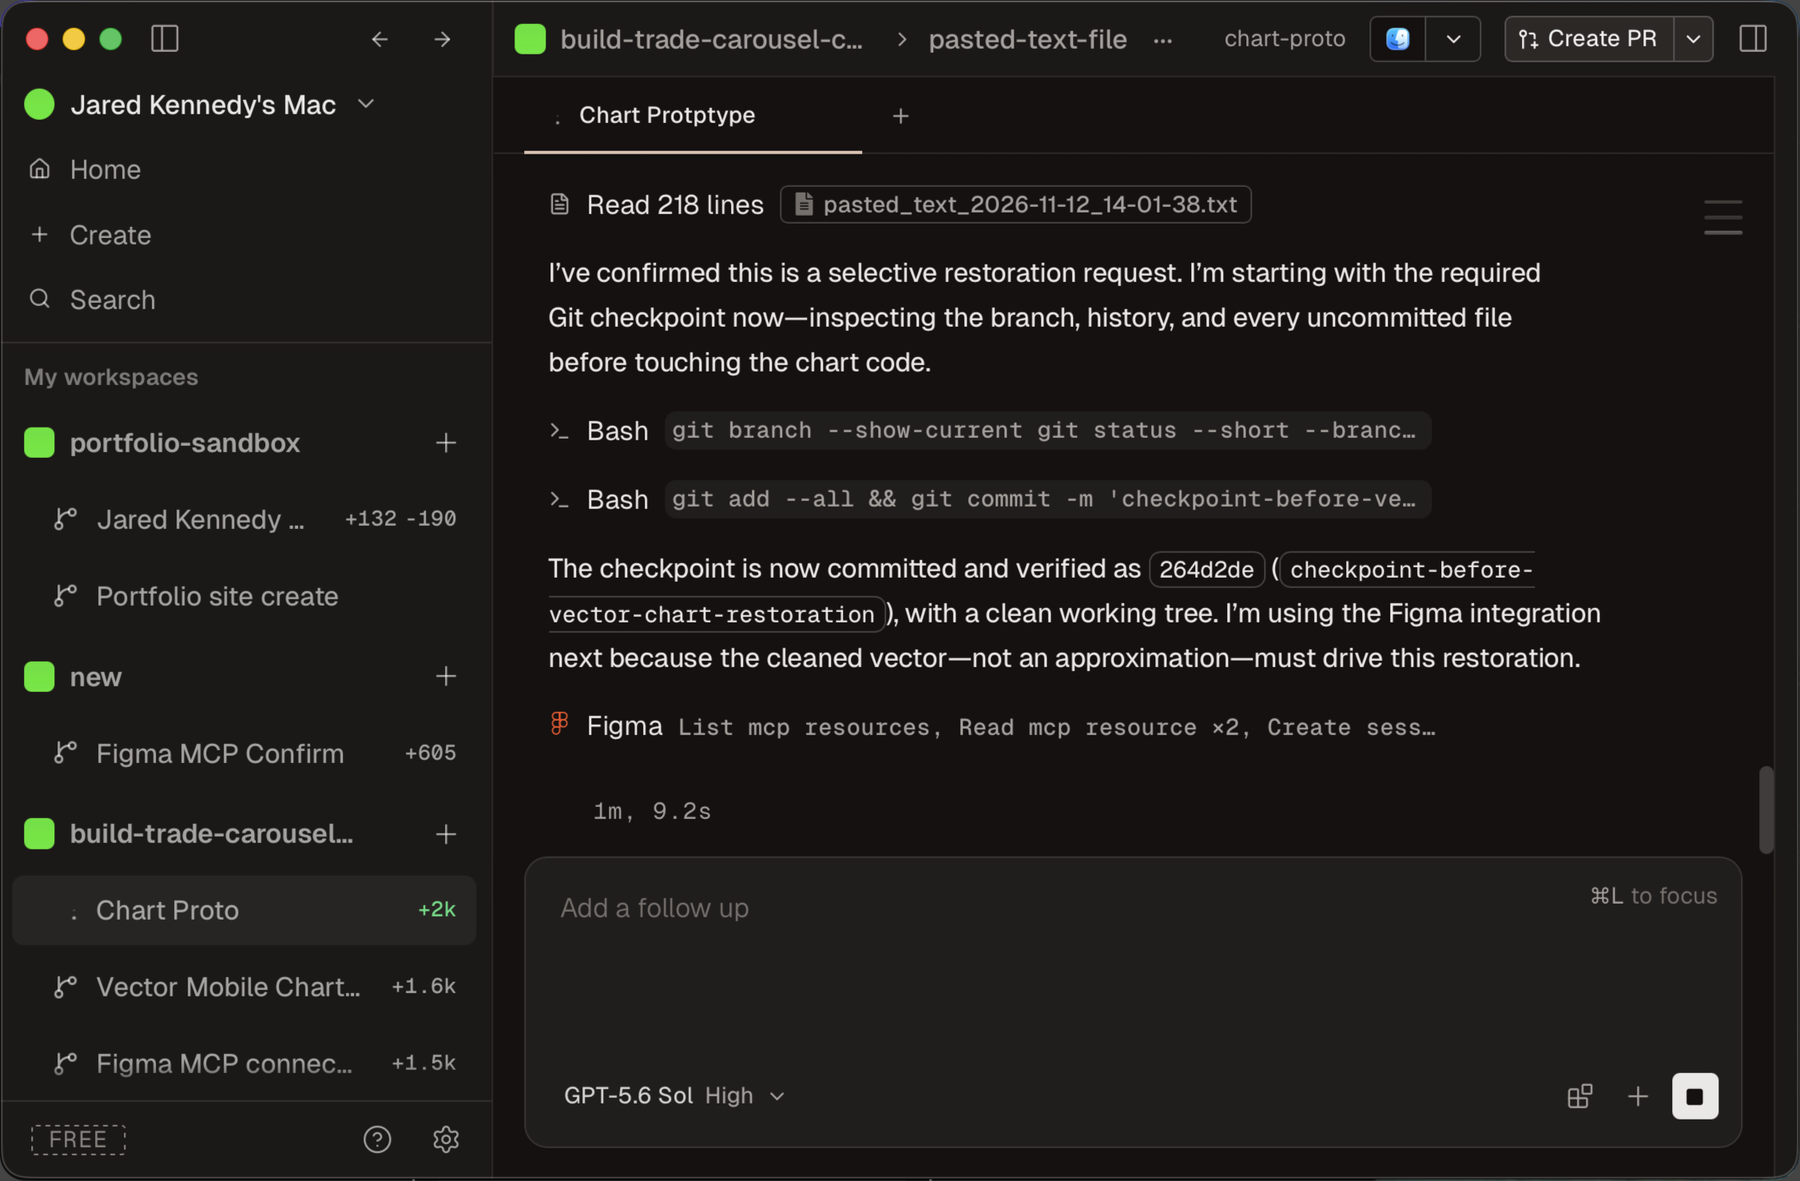
Swipe through the trades or select a face on the chart. The figures show the position at the selected update. Scroll inside the phone to see more.
On mobile, readers could open a broadcast, discuss the trade, and open the coin to review their own position or trade it.

“One idea we pioneered was putting faces and trades directly on the chart.”Phil Jacobson · Vector retrospective
The mobile feed brought shared trades, discussion, and execution into one flow. Readers could inspect the author’s shared activity before opening the coin to make their own decision.
Jacobson recalls people following traders, sharing ideas, and acting on trades they saw. Feed-specific usage and retention figures are not available. Across Vector, trading volume peaked above $20 million in a day.